application A: max torque
(bigger maximum torque (in low rpm) doesn't necessarily translates to a more powerful vehicle)
In this application we have 2 identical cars with different engines / transmissions and different power delivery characteristics. The first is a turbodiesel with 109ps-4000rpm / 270Nm-1750rpm and the other has a naturally aspirated petrol engine with 158ps-6200rpm / 213Nm-3300rpm. We will examine the effect the bigger torque of the first car will have in the actual thrust on the wheel in the velocity span.
In the following graph there is a comparative view of the two cars thrust curves. The turbodiesel car (red) is stronger in velocities of 25kph and below and above that it lacks more or less than the petrol-powered car (blue).
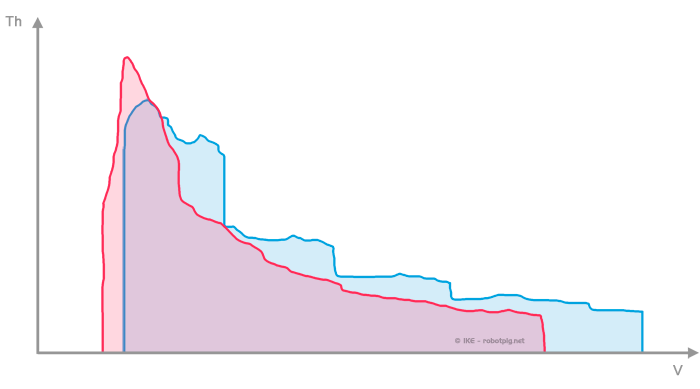
In a first view we could say that it is confirmed that bigger torque (in low rpm) equals to more thrust, even though that takes place to a very narrow velocity band (0-25kph). By looking the graph more carefully we can see that the main reason behind the thrust peak is the very big reduction ratio of the turbodiesel transmission. The turbodiesel car has lower gearing and its gearbox is close ratio in comparison to the gasoline-powered car. (meaning that its 2nd gear is closer to the 3rd than the 2nd and 3rd gear of the gasoline car are.)
What is the reason that forced the constructor to equip two identical (except the engine) cars with such different gearing? The answer is simple; the constructor just paired the gearing to the power delivery characteristics of each engine. The turbodiesel engine with its narrow revspan and its power deficit needs lower and more closely matched gearing in comparison with the gasoline engine.
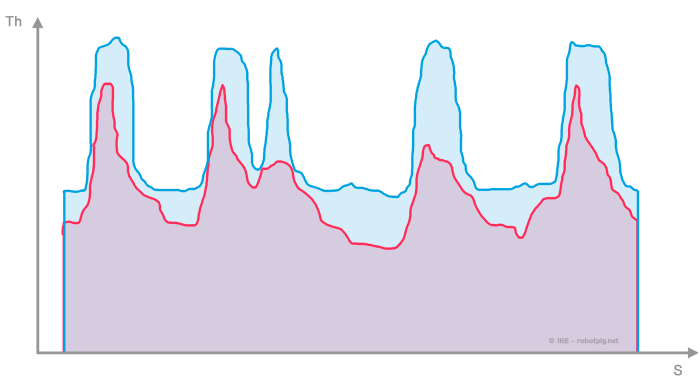
In the track the thrust /lap diagram below (with a velocity of 70% of the original, as mentioned before) we can see that the gasoline-powered car (blue) has always an advantage because we are constantly above 25kph.
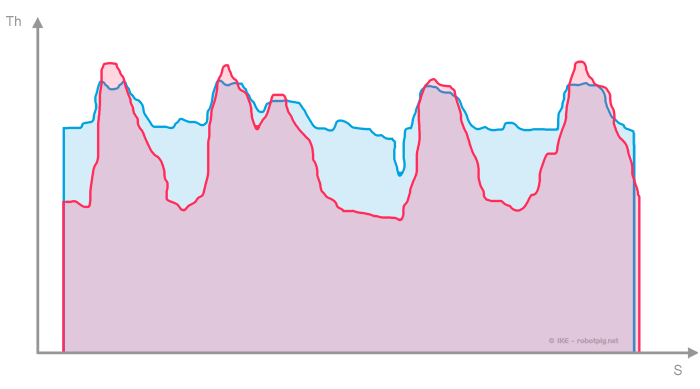
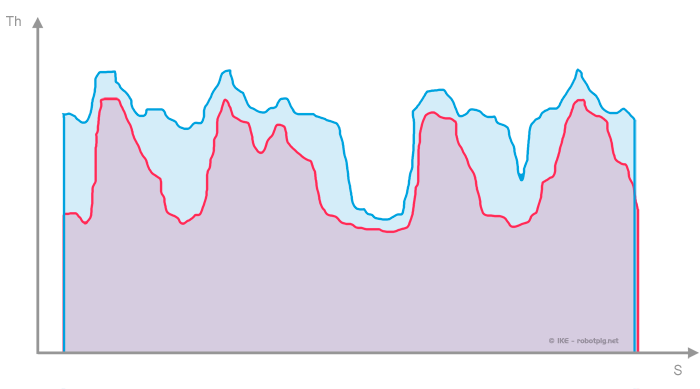
 If the reference velocity is lowered to 40% of the original, the turbodiesel car has the advantage in the areas where the speed is low enough. However even now the gasoline car is more powerful most of the time.
 If we lower the gearing to the gasoline-powered car (a very easy conversion for this model) it will be similarly low-geared as the diesel one. The thrust curve diagram will now be:
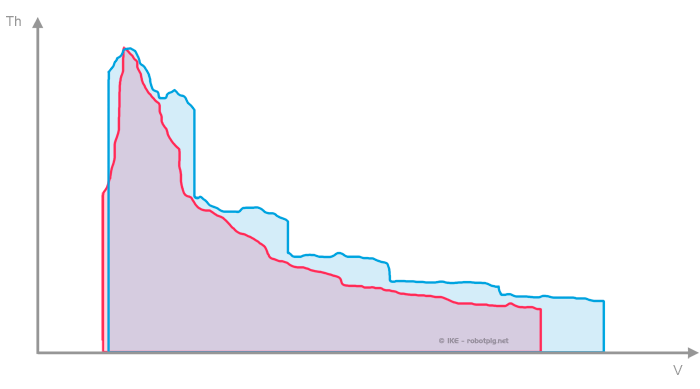 With the lower gearing, the gasoline-powered car has more thrust through the entire velocity span. Considering we only change the differential reduction ratio it is obvious that the thrust curves haven't change shape, they just moved to the left and the gearbox ratios have the same spacing.
Overlaying the thrust curves to the reference lap (again at 40% of the original velocity) the gasoline car with the lower gearing (blue) as expected has the advantage everywhere, even in very low speed.
 The conclusion is that a car with more torque in low revs isn't necessarily more powerful in low speeds than a similar with less torque if the transmission gearing is selected accordingly.
The popularity of diesel engines in passenger cars and their almost absolute dominance in the commercial sector is due to their lower fuel consumption and not because they produce more thrust (for a given technology level, otto engines are more powerfull).
The conclusion is that a car with more torque in low revs isn't necessarily more powerful in low speeds than a similar with less torque if the transmission gearing is selected accordingly.
The popularity of diesel engines in passenger cars and their almost absolute dominance in the commercial sector is due to their lower fuel consumption and not because they produce more thrust (for a given technology level, otto engines are more powerfull).
The fuel consumption advantage of the diesel engine comes from the much higher compression ratio that equates to a higher efficiency. More details on this subject is beyond the scope of this article.