thrust curves
In order to observe how much force reaches the tire we need the thrust curves and to plot it we need:
- power curve
- gearbox ratios
- transfer box reduction ratio*
- differential reduction ratio
- wheel diameter
*transfer box, this is the high-low selection, avaliable in many off-road models
With all of the above and by using the formula below we plot the thrust curves,
thrust=(power/revolutions per minute)*(1st gear recuction ratio)*(transfer box reduction ratio)*(differential reduction ratio)*(2/wheel diameter) (similarly for 2nd, 3rd etc)
The thrust curves for every gear are:
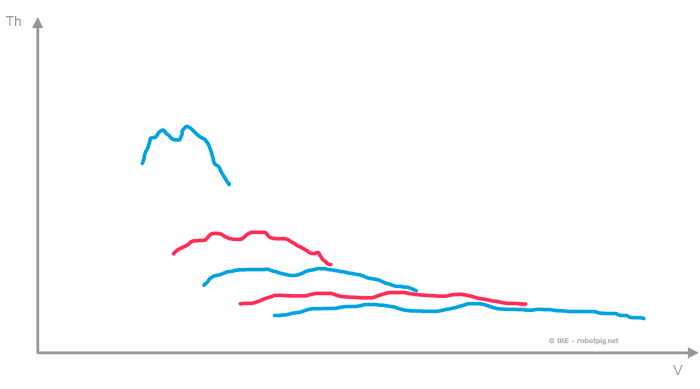
and all gears combined to a single diagram:
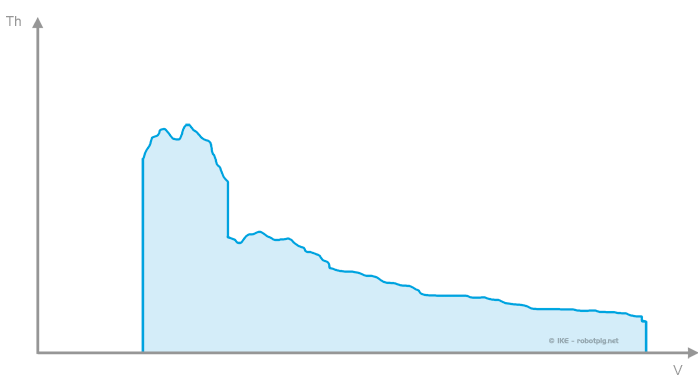
The diagram above has the velocity of the vehicle in the horizontal axis and in the vertical axis the available thrust (force) in the powered wheels.
It is apparent that the thrust curves diagram is nothing else but the power curves elevated for each gear ratio. Here lies one of the most common misunderstandings:
Judging how powerful a car is from a single value of its maximum power (or torque) is in effect eliminating all the curve of the diagram with the exception of 5 single points (for a 5-speed gearbox). Usually it is worse than that because by not taking at all into account the transmission system we do not have these points either because we cannot know their position neither on the horizontal nor the vertical axis. What we are left is a single point (that of the maximum power) that in reality doesn't say anything at all.
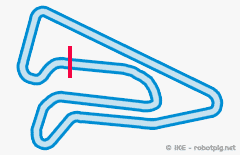
reference route
All the above will be applied to an example with many applications in order to cover most cases. In order how the thrust curves diagram is translated in reality we will project it over a reference route.
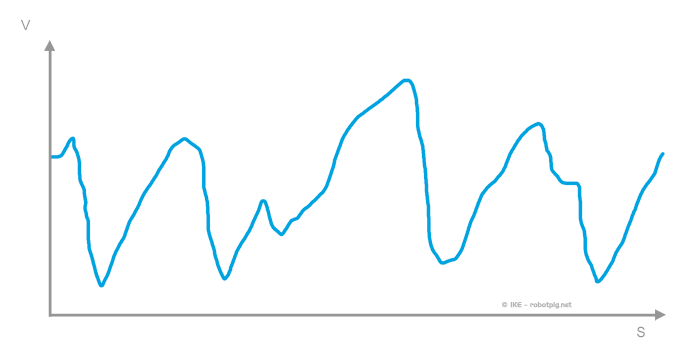
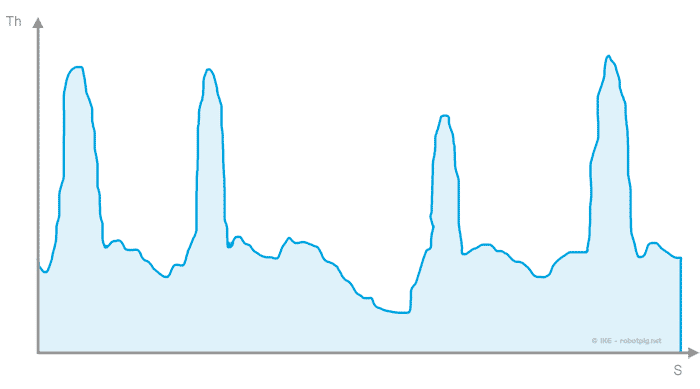
We selected a small racetrack (more details in the box on the right) where a single lap gives the following diagram of the velocity in respect to the distance covered:
If we match the thrust for the respected velocity in every point of the lap (by using the thrust curve diagram) we end up with a diagram of thrust / distance for this specific track (and for these specific velocities for each point!)
With this numerical trick we have the thrust 'reserve' the vehicle will have in every point. The bigger the reserve, the bigger its ability to accelerate or to transport a mass.
One can point out that a more powerful car would lap faster thus producing a different velocity/distance graph. However we will use this data for comparison only and we assume that all cars would move in the same manner. We will compare the thrust reserve for each subject over the route (for more you can read the remarks at the end).
In order to have a more realistic view and also to rule out extreme situation where other factors become important the velocity of a lap for a car is reduced to 70% of the original reference lap (read on the box on the right for details) unless mentioned differently. This is well within the limits of usual road circumstances and will help the accuracy of our examples..